ConcurrentDictionary<TKey, TValue> is slow. Or is it?
On this year’s MS Fest Jarda Jirava had a presentation about Akka.Net. I was interested in this topic, because the actor model is one way (out if many – sadly no silver bullet yet) to tackle concurrency and parallelism problems.
While showing some actor demos there was a nice comparison with home made solutions. So you don’t have to go to full framework to try thinking in actors. The demo was just storing some key and value into a hashtable. The hand made was first using just plain old Dictionary<int, int> with lock/Monitor and then using ConcurrentDictionary<int, int>. To mine (and Jarda’s surprise too) the ConcurrentDictionary<int, int> was slower. So I started digging into it and looking for a reason. Because I was confident the ConcurrentDictionary<int, int> should be faster compared to only single Monitor.
The test code
Based on the presentation code I extracted a simple test bench to play with. I focused on having as less moving parts as possible, to be able to exactly control what my code is doing. I ended up with this code.
public class Test
{
	object _syncRoot;
	Dictionary<int, int> _monitorDictionary;
	ConcurrentDictionary<int, int> _concurrentDictionary;

	public Test()
	{
		_syncRoot = new object();
		_monitorDictionary = new Dictionary<int, int>();
		_concurrentDictionary = new ConcurrentDictionary<int, int>();
	}

	public void MonitorDictionary()
	{
		TestHelper(i =>
		{
			lock (_syncRoot)
			{
				_monitorDictionary[i] = i;
			}
		}, "Monitor");
	}

	public void ConcurrentDictionary()
	{
		TestHelper(i =>
		{
			_concurrentDictionary[i] = i;
		}, "Concurrent");
	}

	static void TestHelper(Action<int> test, string name)
	{
		Console.Write($"{name}:\t");
		var sw = Stopwatch.StartNew();
		Parallel.For(0, 40000000, test);
		Console.WriteLine(sw.Elapsed);
	}
}
I’m running it with optimizations turned on, without debugger attached and in 64-bits (this doesn’t matter that much). Depending on your machine, number of iterations (thus number of items in hashtable) you’ll get different numbers. But for sure the Monitor version will be way faster.
Concurrent:     00:00:14.3312184
Monitor:        00:00:03.4833102
So why is this?
Thinking
Looking at the code, you clearly spot two interesting pieces. The code is adding unique keys to the dictionary. Thus there will be no updates of values and it will be just inserting new items.
Also, there’s nothing happening around. It’s just adding the items as quickly as possible. Hammering the locking. That’s far from regular case.
And finally, running the code shows that for Monitor version the CPU is 100% used (all cores) while for the Concurrent it isn’t.
Reason
If you look at the TryAddInternal method of ConcurrentDictionary<TKey, TValue> you’ll see it’s using Node class to handle the items. So that means allocations.
Second clue is in GrowTable method. And it’s doing quite a locking and shuffling of locks (and of course also the resizing).
It must be GC. I’m pretty sure. Let’s test it. I’ll use the Diagnostic Tools window in Visual Studio.
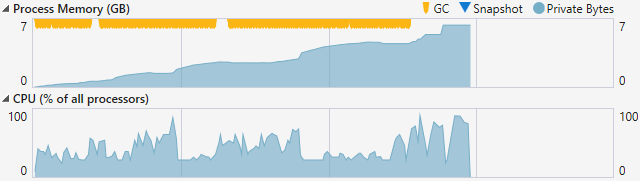
Whoa. There’s a lot of GC-ing happening. Theory confirmed. Then also running a profiler shows a hot spot in GrowTable method. As expected. We’re adding a lot of items.
Solution
Well, there’s really none. In this specific edge case the single, hand crafted, Monitor will beat the ConcurrentDictionary<TKey, TValue>. But is it really a problem for a real world application?
The items are unique and just added as quickly as possible. It could be some list or bag implementations (i.e. ConcurrentBag<T>) might behave better for our case.
Closer to the real world application?
What if I modify the code that it’s not only adding, but also updating items?
public void MonitorDictionary()
{
	TestHelper(i =>
	{
		lock (_syncRoot)
		{
			_monitorDictionary[i % 10] = i;
		}
	}, "Monitor");
}

public void ConcurrentDictionary()
{
	TestHelper(i =>
	{
		_concurrentDictionary[i % 10] = i;
	}, "Concurrent");
}
Running the code with this modification gives me comparable results for both versions. Using then i % 100 as the index makes the ConcurrentDictionary<TKey, TValue> clear winner.
What if I do some processing around?
public void MonitorDictionary()
{
	TestHelper(i =>
	{
		Processing();
		lock (_syncRoot)
		{
			_monitorDictionary[i] = i;
		}
	}, "Monitor");
}

public void ConcurrentDictionary()
{
	TestHelper(i =>
	{
		Processing();
		_concurrentDictionary[i] = i;
	}, "Concurrent");
}

static int Processing()
{
	var sum = 0;
	for (var i = 0; i < 4000; i++)
	{
		sum += i;
	}
	return sum;
}
This time the difference is not that significant (in real world it would depend on what is the Processing method doing and how long it takes). The locking is not hammered like crazy and the GC has a room to breathe.
Conclusion
During the presentation my guess was that there’s some false sharing and/or trashing happening. I couldn’t have been more wrong, as you can see from two modifications above. Testing concurrent performance with synthetic test is far from what the code will do in real, hence it’s more than desired to run tests with as close to real setup as possible.
As usual with this deep stuff. It has been a joy – for me – to dig into this problem and to start connecting the dots. And then slightly modifying the code to get to expected or desired behavior.
