Run To Cursor in Call Stack window
Today I found a great new feature for debugging in Visual Studio. Maybe you know the Run to Cursor feature (if not, I’ll explain it in next paragraph), but did you know you can use the same feature from Call Stack as well?
The Run to Cursor feature (shortcut Ctrl-F10) is my favorite feature. It allows you to place cursor on some line and run to that line. Something like a temporary breakpoint. I use it very often. And in Visual Studio 2017 this works also for Call Stack window.
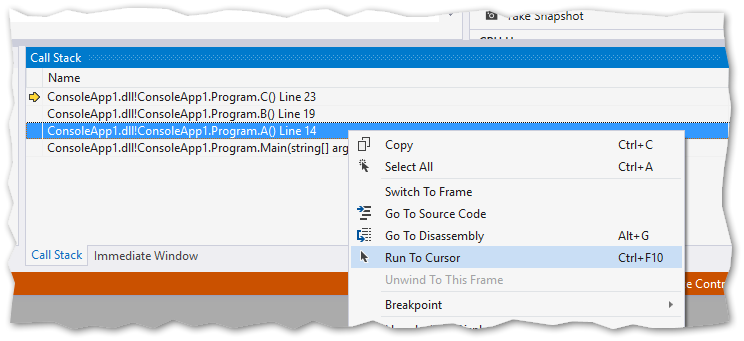
As you’re debugging, very likely you’re stepping into some functions (F11) and going deeper and deeper. Once you nailed it or fixed it, you might want to jump out of this hole and continue where you started. You can do bunch of Shift-F11s to jump out of the function(s), but you can do better. Right click on a frame in Call Stack window and voilà, the Run to Cursor (same Ctrl-F10 shortcut) is there. Although same result can be achieve using different steps too, this one is very smooth.
Another tool into my, and your, toolbelt to be efficient while debugging.
